No subject is more misunderstood than that of trading risk. I see so many varying opinions, and a lot of traders have major misconceptions about it. This is partially brought about by financial industry professionals and academia. I won’t get started on the value (or lack thereof) of most formal education, but I will say that a lot of what’s taught in universities and what’s commonly accepted “knowledge” in the financial industry is complete BS.
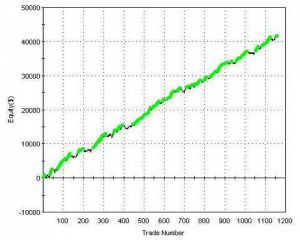
Let’s take the concept of the Sharpe Ratio for instance. When it comes to trading results, I think it’s one of the most overrated and plain out wrong measures out there. The Sharpe ratio measures return relative to account volatility, and this is used as a gauge for risk-adjusted return. But is account volatility really risk? Let’s take a look at two trading equity curves below, which cover a similar trading period. Which one do you think is the riskier strategy?
A tale of Two Strategies
Equity Curve #1:
Equity curve #2
From a pure visual perspective, it would seem that the second strategy which produced Equity curve #2 is the one with less risk. It will certainly have a much higher Sharpe ratio. But does that mean that if you were trading such a strategy your risk would really be low?
True Trading Risk
The answer is: not necessarily. This may be an arbitrage strategy which is wildly consistent, winning a very high percentage of the time, but is susceptible to “black swan events”. i.e. It could be a strategy that has extremely large downside. Like picking up dimes in front of a steam roller. You can make a lot of money doing it, but sooner or later you will get run over. That’s precisely what happened to LTCM (a hedge fund from the late 90’s). It was run by Noble Prize Laureates who believed in Sharpe Ratios and random markets. The account volatility was extremely low. The Sharpe ratio was extremely high. They were deemed market gods. And then it all came crashing down.
But throughout that period, and stretching back over 30 years, there was a different kind of hedge fund. One that had an equity curve more similar to #1 above. That’s the trend following fund, and that fund is still in existence today. Its Sharpe ratio sucks. And some people would call it risky. But it’s been around for 40 years and is still going strong. That’s because account volatility does not necessarily equal risk. Real risk, is the risk of ruin, and that is not something that will necessarily show up in the charts. It’s there if you use position sizing that is too large for your account. It’s there if you try to scalp for ticks while having really large stop losses. It’s there if you care only about accuracy and leave yourself susceptible to rare events that can wipe you out. These things may not show up in your equity curve for a while as things go your way. And you might be fooled into thinking you have low risk in your trading. But don’t be fooled. The market will have your number.
The Best Way To Think About Trading Risk
Your better bet is to use correct position sizing and risk management, and to tolerate drawdowns (i.e. account volatility) as long as you have the basics covered. Of course the drawdowns should be contained or else the mathematical- and psychological- odds of recovery become small. But don’t try to eliminate them, and don’t think your strategy is riskier if you have larger drawdowns than another trader. He or she could be trading a style that shows great consistency but is bound to blow up. Always think about risk of ruin. That’s your true risk. The account volatility is only risk if you let it become excessive. Otherwise it’s just a discomfort that all great traders learn to live with.


